Integration dashboard
Axiom automatically creates an integration dashboard when you start sending Do11y data from your docs site. To access the dashboard:
- In Axiom, click Dashboards.
- In the Integrations section, click Documentation observability (Do11y) (DATASET_NAME).
Alternatively, go directly to https://app.axiom.co/ORG_ID/dashboards/do11y.DATASET_NAME. Replace ORG_ID with your Axiom organization ID and DATASET_NAME with the name of the dataset you created for Do11y.
Each section answers a different question about how users experience your docs.
Traffic and discovery
Where does your audience come from, and what do they find first?
This section breaks down traffic by source: search engines, direct visits, social networks, community sites, code hosts, and AI platforms. On the AI-specific charts, you can see which AI platforms are sending users to your docs, which pages they land on, and whether those visitors engage differently from users who arrive through other channels. If AI-referred traffic is growing week over week, that is a signal to make sure the pages AI tools surface are accurate and complete.
Engagement and page performance
Which pages are actually working?
Engagement in the dashboard is measured by three signals: how long users are actively reading, how far down the page they scroll, and a composite engagement score that combines both. Pages with high traffic but low engagement are the clearest candidates for improvement. The bounce detection chart is a good starting point. It surfaces pages where users leave within seconds, which usually means the content didn't match what they expected to find.
Where users get stuck
Where do users give up or look for help?
Exit pages show where multi-page journeys end. A page that appears often as the last stop before a user leaves may be missing a next step, an explanation, or a link to related content. The high search rate chart is another strong signal. When users search immediately after landing on a page, it usually means the page answers a different question than the one they had in mind.
Navigation patterns
How do users move through your docs?
Most documentation is written as a tree, but users rarely navigate that way. The page-to-page transition chart shows the actual paths users take, which often reveals that certain pages act as hubs or that users jump between sections you would not have expected to be related. Journey depth shows how many pages users visit in a session, which helps you understand whether users are exploring broadly or coming for a single answer.
Link and CTA performance
Are users following the paths you have designed for them?
Link clicks tell you which calls to action land and which go unnoticed. Pages with many views but few link clicks may lack a clear next step.
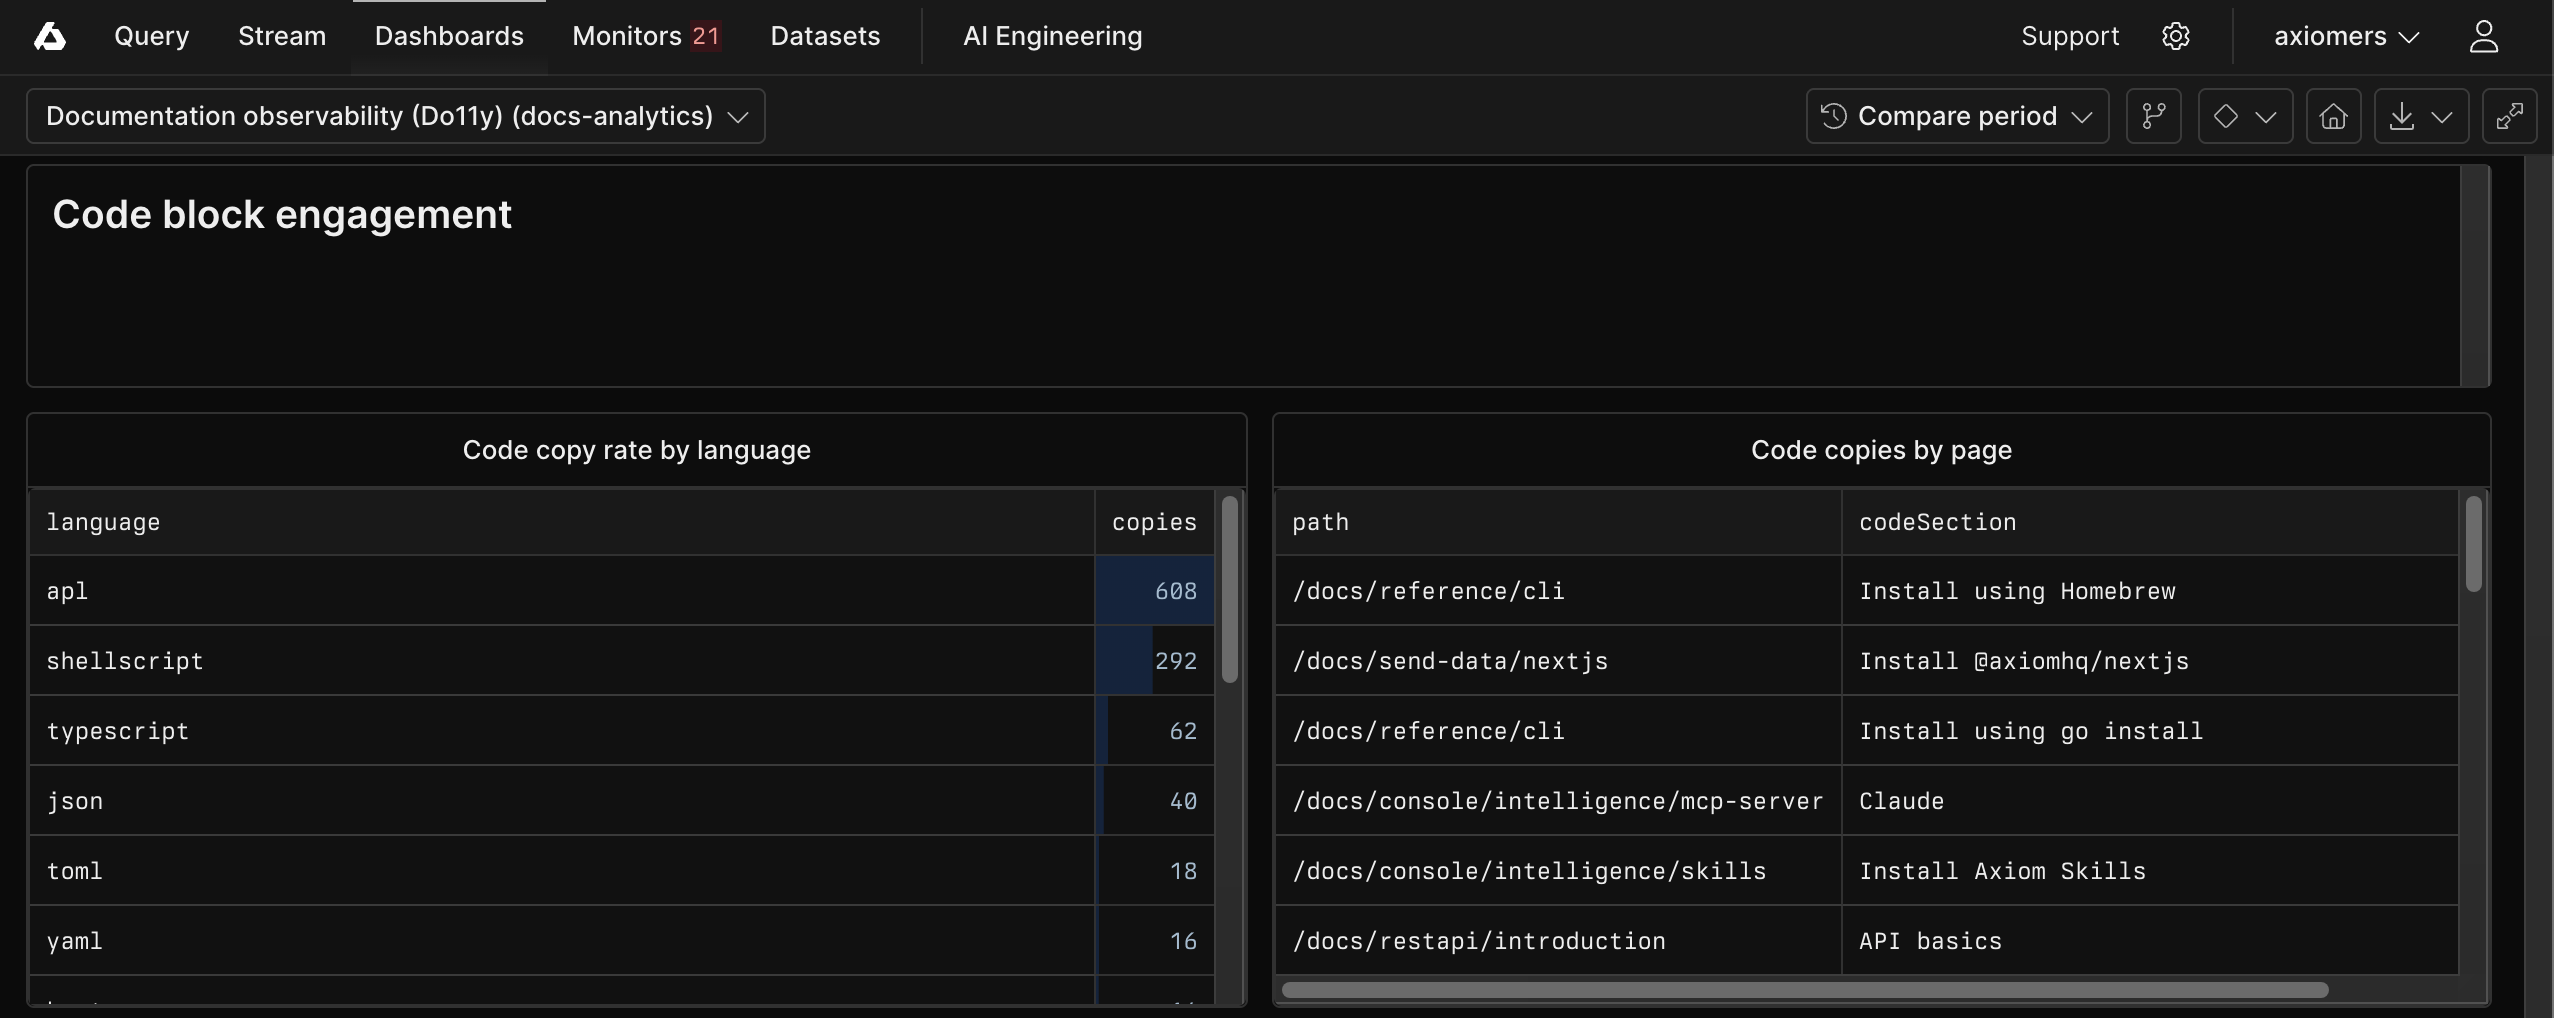
Code block engagement
Are users putting your code to use?
Copy events are one of the clearest signals that a user intends to act on what they have read. The code engagement charts show which languages and which pages generate the most copies. A page with high views but few code copies may benefit from clearer, more practical examples.
Reading depth and content structure
Are users reading what you wrote, or skimming past it?
The section reading patterns, table of contents usage, and expand/collapse charts together paint a picture of how users navigate within a page. Sections that users skip consistently may need to be cut or moved. Pages with heavy table of contents usage suggest users are hunting for something specific and the page structure is not guiding them there. Splitting the page or improving headings often helps.
User feedback
What do users think?
The feedback chart aggregates ratings from the page-level feedback widget. Pages with the lowest helpful percentage and the most responses are the highest-priority candidates for revision. Combine this with the engagement charts to decide whether the issue is content quality or discoverability.
Device and context
Who is your audience and how are they reading?
The device and browser charts help you spot platform-specific problems. If mobile users show significantly lower scroll depth than desktop users, the page layout may not adapt well to smaller screens. Browser distribution tells you where to focus cross-browser testing.